What people complain about in 1-star app reviews
29,785 one-star reviews of 273 App Store and Google Play listings from 227 brands, posted 25 Oct 2025 – 24 Oct 2026 in the United States, United Kingdom, India, Canada, Australia and Ireland. Classified by keyword pattern into 10 complaint themes.
Key findings
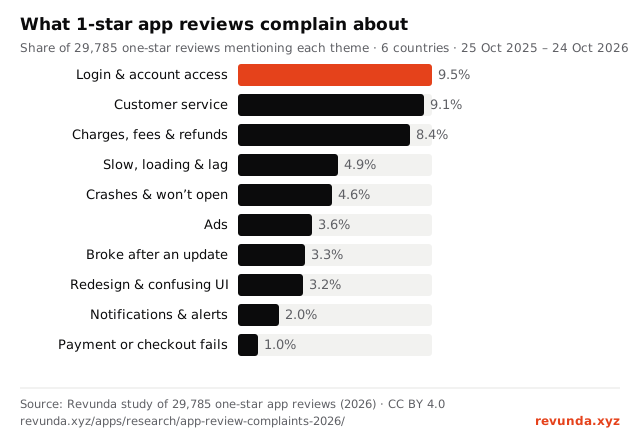
- Login & account access is the most common complaint theme: 9.5% of one-star reviews, ahead of customer service (9.1%) and charges, fees & refunds (8.4%).
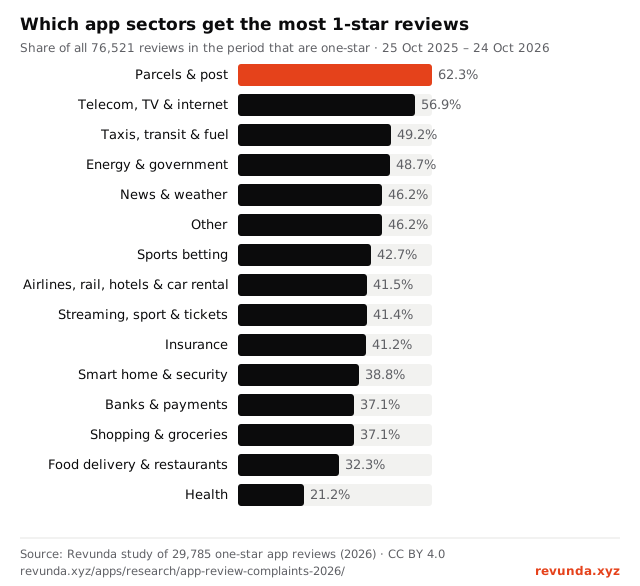
- Parcels & post apps get the angriest reviews: 62.3% of all their reviews in the period are one-star (Telecom, TV & internet: 56.9%; lowest is Health at 21.2%).
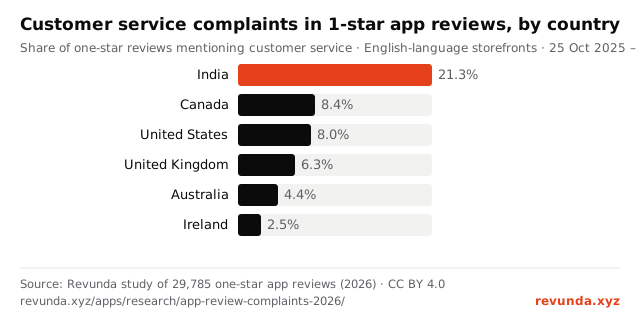
- In India, 21.3% of one-star reviews are about customer service, against 8.0% in the United States; login complaints are 2.8% (US 8.7%).
- Ads drive 24.7% of one-star reviews for news & weather apps (all apps: 3.6%); Channel 4 (iOS) tops the list at 64.8%.
- Login is 24.5% of one-star reviews for energy & government apps; for myGov (iOS) it is 42.1%.
- Updates break smart home apps: 10.3% of their one-star reviews blame a recent update (all apps: 3.3%); Blink Home Monitor (iOS): 34.3%.
- 59.4% of one-star reviews match none of the 10 themes: they are short verdicts or service-specific complaints.
For journalists and researchers
| Sample | 29,785 one-star reviews (English-language storefronts) out of 76,521 reviews of 274 App Store and Google Play listings, 227 brands |
|---|---|
| Period | 25 Oct 2025 – 24 Oct 2026; fetched 24 Oct 2026 |
| Method | 10 complaint themes matched by published keyword patterns (no AI); hand check 55 of 60 matches on topic. Details |
| Credit line | Source: Revunda (revunda.xyz), analysis of 29,785 one-star app reviews, 2026 |
| Licence | CC BY 4.0: reuse, chart and republish with credit and a link to this page |
| Data | CSV · Themes chart (SVG) · Sectors chart (SVG) · Countries chart (SVG) |
| Questions | hello@revunda.xyz |
Summary to quote
Complaint themes across all apps
Share of 29,785 one-star reviews that mention each theme. A review can match several themes.
Embed this chart
Image + link (works in most CMSs)
Interactive embed (iframe)
Download SVG · HTML · Free to reuse under CC BY 4.0 with a link to the study.
By sector
Share of all reviews in the period that are one-star (all languages and storefronts, 76,521 reviews):
Embed this chart
Image + link (works in most CMSs)
Interactive embed (iframe)
Download SVG · HTML · Free to reuse under CC BY 4.0 with a link to the study.
Share of each sector’s one-star reviews (English storefronts) mentioning each theme, %. Columns: Login = login & account access, Crash = crashes & won’t open, Slow = slow, loading & lag, Update = broke after an update, Service = customer service, Charges = charges, fees & refunds, Payment = payment or checkout fails, UI = redesign & confusing ui, Alerts = notifications & alerts.
| Sector | Listings | 1★ reviews | Login | Crash | Slow | Update | Service | Charges | Payment | UI | Ads | Alerts |
|---|---|---|---|---|---|---|---|---|---|---|---|---|
| Parcels & post | 7 | 1,218 | 14.1 | 2.4 | 2.3 | 1.5 | 7.5 | 1.6 | 0.2 | 1.6 | 1.1 | 2.9 |
| Telecom, TV & internet | 29 | 4,515 | 11.5 | 3.5 | 6.5 | 2.0 | 12.4 | 7.6 | 0.4 | 2.0 | 1.3 | 1.2 |
| Taxis, transit & fuel | 11 | 1,345 | 2.5 | 1.4 | 1.4 | 1.0 | 14.1 | 15.1 | 0.6 | 1.3 | 2.8 | 1.0 |
| Energy & government | 5 | 703 | 24.5 | 2.1 | 1.6 | 2.3 | 2.3 | 3.0 | 0.1 | 4.1 | 0.0 | 1.6 |
| News & weather | 7 | 938 | 4.9 | 4.7 | 2.2 | 2.8 | 0.9 | 11.2 | 0.1 | 1.9 | 24.7 | 3.6 |
| Other | 12 | 1,204 | 4.5 | 7.4 | 7.4 | 6.7 | 3.7 | 13.0 | 0.3 | 5.9 | 2.0 | 1.2 |
| Sports betting | 5 | 638 | 7.7 | 4.5 | 4.1 | 0.9 | 11.0 | 4.1 | 0.0 | 0.9 | 2.0 | 0.3 |
| Airlines, rail, hotels & car rental | 24 | 2,307 | 8.6 | 4.1 | 4.4 | 2.5 | 10.7 | 10.8 | 1.2 | 2.9 | 1.2 | 1.4 |
| Streaming, sport & tickets | 24 | 2,792 | 5.6 | 6.9 | 5.8 | 2.5 | 3.9 | 13.9 | 0.5 | 2.7 | 12.4 | 1.4 |
| Insurance | 8 | 867 | 18.0 | 2.5 | 4.3 | 1.0 | 8.4 | 6.5 | 0.9 | 2.2 | 1.3 | 1.4 |
| Smart home & security | 12 | 1,108 | 4.8 | 5.5 | 8.2 | 10.3 | 5.8 | 9.2 | 0.2 | 4.9 | 2.4 | 9.2 |
| Banks & payments | 51 | 4,894 | 13.6 | 5.7 | 5.3 | 5.8 | 8.6 | 4.3 | 0.6 | 6.7 | 1.8 | 2.5 |
| Shopping & groceries | 52 | 5,168 | 6.7 | 5.6 | 5.4 | 2.9 | 11.8 | 8.0 | 3.4 | 2.1 | 3.4 | 1.5 |
| Food delivery & restaurants | 17 | 1,452 | 9.5 | 2.4 | 2.6 | 1.9 | 12.5 | 12.5 | 0.8 | 1.2 | 1.4 | 0.6 |
| Health | 10 | 636 | 9.9 | 2.0 | 1.7 | 2.0 | 3.8 | 5.0 | 0.6 | 3.6 | 0.9 | 3.3 |
By country
Customer service share of one-star reviews, by storefront country.
Embed this chart
Image + link (works in most CMSs)
Interactive embed (iframe)
Download SVG · HTML · Free to reuse under CC BY 4.0 with a link to the study.
| Country | Listings | 1★ reviews | 1★ share | Login | Service | Charges | Crash | Slow | UI | Ads |
|---|---|---|---|---|---|---|---|---|---|---|
| United States | 161 | 13,050 | 40.4 | 8.7 | 8.0 | 9.8 | 4.2 | 5.3 | 2.5 | 5.0 |
| United Kingdom | 128 | 6,490 | 39.3 | 11.0 | 6.3 | 4.5 | 5.9 | 5.3 | 3.9 | 4.0 |
| India | 50 | 4,044 | 39.7 | 2.8 | 21.3 | 13.5 | 1.7 | 3.0 | 1.7 | 1.8 |
| Canada | 86 | 3,150 | 52.0 | 14.5 | 8.4 | 7.8 | 6.7 | 5.5 | 2.6 | 2.2 |
| Australia | 64 | 2,437 | 45.5 | 12.9 | 4.4 | 4.9 | 5.1 | 4.4 | 3.7 | 1.4 |
| Ireland | 19 | 609 | 54.4 | 12.8 | 2.5 | 3.6 | 5.6 | 6.2 | 20.2 | 1.3 |
Not shown (fewer than 100 one-star reviews): New Zealand (5).
Country differences partly reflect app mix. Largest sector by share of one-star reviews: United States – Telecom, TV & internet (14.8%); United Kingdom – Shopping & groceries (21.1%); India – Shopping & groceries (32.0%); Canada – Banks & payments (35.4%); Australia – Banks & payments (22.0%); Ireland – Banks & payments (85.1%).
Apps with the highest share of each complaint
Among 252 listings with at least 30 one-star reviews in the period. Share = that app’s one-star reviews mentioning the theme.
Login & account access
| App | Store | 1★ reviews | Share |
|---|---|---|---|
| myGov | iOS | 259 | 42.1% |
| My Virgin Media Account | iOS | 81 | 37.0% |
| Costa Coffee Club | iOS | 96 | 36.5% |
| My O2 | iOS | 258 | 34.9% |
| BMO Mobile Banking | iOS | 174 | 31.0% |
Crashes & won’t open
| App | Store | 1★ reviews | Share |
|---|---|---|---|
| Ocado | iOS | 60 | 21.7% |
| Intuit QuickBooks for Business | iOS | 147 | 21.1% |
| Westpac | iOS | 81 | 21.0% |
| ITVX | iOS | 170 | 19.4% |
| Ring | iOS | 145 | 19.3% |
Slow, loading & lag
| App | Store | 1★ reviews | Share |
|---|---|---|---|
| The Home Depot | Google Play | 98 | 34.7% |
| The Home Depot | iOS | 98 | 33.7% |
| Tesco Grocery & Clubcard | iOS | 131 | 26.0% |
| BMO Mobile Banking | iOS | 174 | 24.7% |
| Intuit QuickBooks for Business | iOS | 147 | 24.5% |
Broke after an update
| App | Store | 1★ reviews | Share |
|---|---|---|---|
| Blink Home Monitor | iOS | 140 | 34.3% |
| BMO Mobile Banking | iOS | 174 | 20.7% |
| Barclays | iOS | 148 | 17.6% |
| Ring | iOS | 145 | 17.2% |
| Barclays | Google Play | 133 | 16.5% |
Customer service
| App | Store | 1★ reviews | Share |
|---|---|---|---|
| Curve Pay | iOS | 67 | 44.8% |
| MakeMyTrip Flight, Hotel, Bus | iOS | 190 | 44.2% |
| Nykaa | iOS | 264 | 42.4% |
| Turo | iOS | 31 | 41.9% |
| Zomato | iOS | 44 | 34.1% |
Charges, fees & refunds
| App | Store | 1★ reviews | Share |
|---|---|---|---|
| Priceline | iOS | 99 | 44.4% |
| Freenow by Lyft | iOS | 42 | 42.9% |
| Fandango | iOS | 131 | 35.9% |
| TurboTax | iOS | 266 | 35.7% |
| BetterHelp | iOS | 37 | 35.1% |
Payment or checkout fails
| App | Store | 1★ reviews | Share |
|---|---|---|---|
| Ocado | iOS | 60 | 20.0% |
| Argos | iOS | 130 | 13.1% |
| The Home Depot | Google Play | 98 | 11.2% |
| Sam's Club Shopping & Delivery | iOS | 72 | 11.1% |
| ASDA | iOS | 231 | 10.8% |
Redesign & confusing UI
| App | Store | 1★ reviews | Share |
|---|---|---|---|
| AIB Mobile | iOS | 197 | 39.6% |
| National Rail | iOS | 95 | 27.4% |
| Barclays | iOS | 148 | 25.7% |
| Blink Home Monitor | iOS | 140 | 17.9% |
| Expensify | iOS | 207 | 17.4% |
Ads
| App | Store | 1★ reviews | Share |
|---|---|---|---|
| Channel 4 | iOS | 108 | 64.8% |
| The Weather Channel | Google Play | 69 | 49.3% |
| FOX News | iOS | 165 | 43.6% |
| iHeart | iOS | 54 | 31.5% |
| AccuWeather | iOS | 159 | 30.2% |
Notifications & alerts
| App | Store | 1★ reviews | Share |
|---|---|---|---|
| Blink Home Monitor | iOS | 140 | 16.4% |
| Rightmove property search | iOS | 43 | 14.0% |
| Ring | Google Play | 80 | 13.8% |
| The Official Wyze App | iOS | 135 | 13.3% |
| SimpliSafe Home Security App | iOS | 92 | 13.0% |
App Store vs Google Play
| Store | Listings | Reviews | 1★ share, % | Top theme |
|---|---|---|---|---|
| App Store | 227 | 62,421 | 44.0 | Login & account access (9.6%) |
| Google Play | 47 | 14,100 | 29.4 | Login & account access (8.9%) |
Method
- Apps: 274 listings (227 App Store, 47 Google Play) of 227 large consumer brands in 15 sectors: banks, insurers, carriers, airlines, delivery, retail, streaming, betting, health, smart home, government and others. Sector assignment is manual.
- Reviews: the newest ~300 public reviews per listing, merged across up to 18 storefronts, fetched on 24 Oct 2026 from Apple’s customer-reviews RSS feed and Google Play (82,019 reviews in total).
- Sample: reviews dated 25 Oct 2025 – 24 Oct 2026 (76,521). One-star share is computed on all of them. Theme shares use the 29,785 one-star reviews from English-language storefronts (US, UK, Canada, Australia, India, Ireland, New Zealand), because the patterns are English.
- Classification: each review’s title and text are matched against one regular expression per theme (listed below). A review can match several themes or none. A hand check of 6 random matches per theme found 55 of 60 on topic; misses included “crashed” about a taxi driver and “checkout” about an upsell.
- Thresholds: an app is ranked only with ≥30 one-star reviews; a sector or country only with ≥100.
Theme patterns
- Login & account access:
\blog ?in\b|\blogin|\blog(?:ged|s)? (?:me )?out\b|\bsign(?:ed|ing)? ?(?:in|on)\b|\bpassword|verification code|\botp\b|\b2fa\b|two[- ]factor|face ?id|touch ?id|fingerprint|biometric|locked out|can'?t (?:access|get into) (?:my )?account - Crashes & won’t open:
\bcrash|\bfreez|\bfroze|keeps? closing|won'?t (?:open|load|launch|start)|doesn'?t (?:open|load|launch)|black screen|white screen|blank screen|\bstuck on\b - Slow, loading & lag:
\bslow|\blag(?:gy|s|ging)?\b|\bloading|takes forever|\bbuffer|\bsluggish|\btim(?:es|ed) out\b - Broke after an update:
(?:since|after) (?:the |this |last |latest |recent |new |an? )?(?:update|upgrade)|(?:new|latest|recent|last) update - Customer service:
customer (?:service|support|care)|\bsupport team|no (?:response|reply)|never (?:responded|replied|got back|heard back)|\bchat ?bot|\bon hold\b|\brepresentative - Charges, fees & refunds:
\bcharg(?:ed|es|ing)\b|\brefund|\boverchar|double[- ]charg|\bbill(?:ed|ing)\b|\bsubscription|\bauto[- ]?renew|\bfees?\b - Payment or checkout fails:
payment (?:fail|declin|not go|did not go|didn'?t go|error|issue)|card (?:was |got |keeps (?:getting )?)?declin|transaction (?:fail|declin)|can'?t (?:pay|make (?:a )?payments?)|unable to (?:pay|make (?:a )?payment)|\bcheck ?out\b - Redesign & confusing UI:
\bredesign|new (?:design|layout|look|interface|ui)\b|old (?:version|design|layout|app)\b|bring back|\bconfus|\bclutter|hard to (?:find|navigate|use)|not (?:user[- ]friendly|intuitive)|\bunintuitive - Ads:
\bads\b|\badvert|\bcommercials?\b - Notifications & alerts:
\bnotification|\balerts?\b
Limitations
- Keyword matching misses paraphrases and sarcasm and catches some off-topic uses; treat shares as lower bounds.
- The newest 300 reviews cover weeks for busy apps and months for quiet ones, so periods differ by app.
- Country and store comparisons are confounded by app mix; Indian reviews often mix English and Hindi, which lowers match rates.
- Public store reviews over-represent angry users and are not a measure of overall satisfaction.
Download the data
app-review-complaints-2026.csv (CSV): every number on this page by overall, store, sector, country and app, with counts and shares per theme. Licence: CC BY 4.0. Please credit Revunda with a link to this page.
Revunda (2026). What people complain about in 1-star app reviews. https://revunda.xyz/apps/research/app-review-complaints-2026/
Link:
<a href="https://revunda.xyz/apps/research/app-review-complaints-2026/">Revunda study of 29,785 one-star app reviews</a>Your own app
Free check runs the same kind of analysis on your app’s latest reviews. The full report is €19 (launch price, €49 from 1 Dec 2026); Monitor is €29/month.