What 29,785 one-star app reviews complain about
When a big app gets a one-star review, most teams guess the cause is a crash. We checked. Across a year of one-star reviews for 274 App Store and Google Play listings from 227 large brands, crashes came fifth. The top three were login trouble, customer service and money.
What we looked at
We pulled the newest public reviews for each listing on 24 Oct 2026: banks, insurers, carriers, airlines, delivery apps, retailers, streaming services, betting apps, health apps, smart home apps and government apps. 76,521 reviews were dated between 25 Oct 2025 and 24 Oct 2026. Of those, 29,785 one-star reviews came from English-language storefronts (US, UK, Canada, Australia, India, Ireland and New Zealand).
Each review's title and text was matched against one plain regular expression per theme. No AI model was involved, and the patterns are published with the study, so anyone can rerun them. A review can match several themes or none. A hand check of 60 random matches found 55 on topic. The misses were things like "crashed" in a story about a taxi driver.
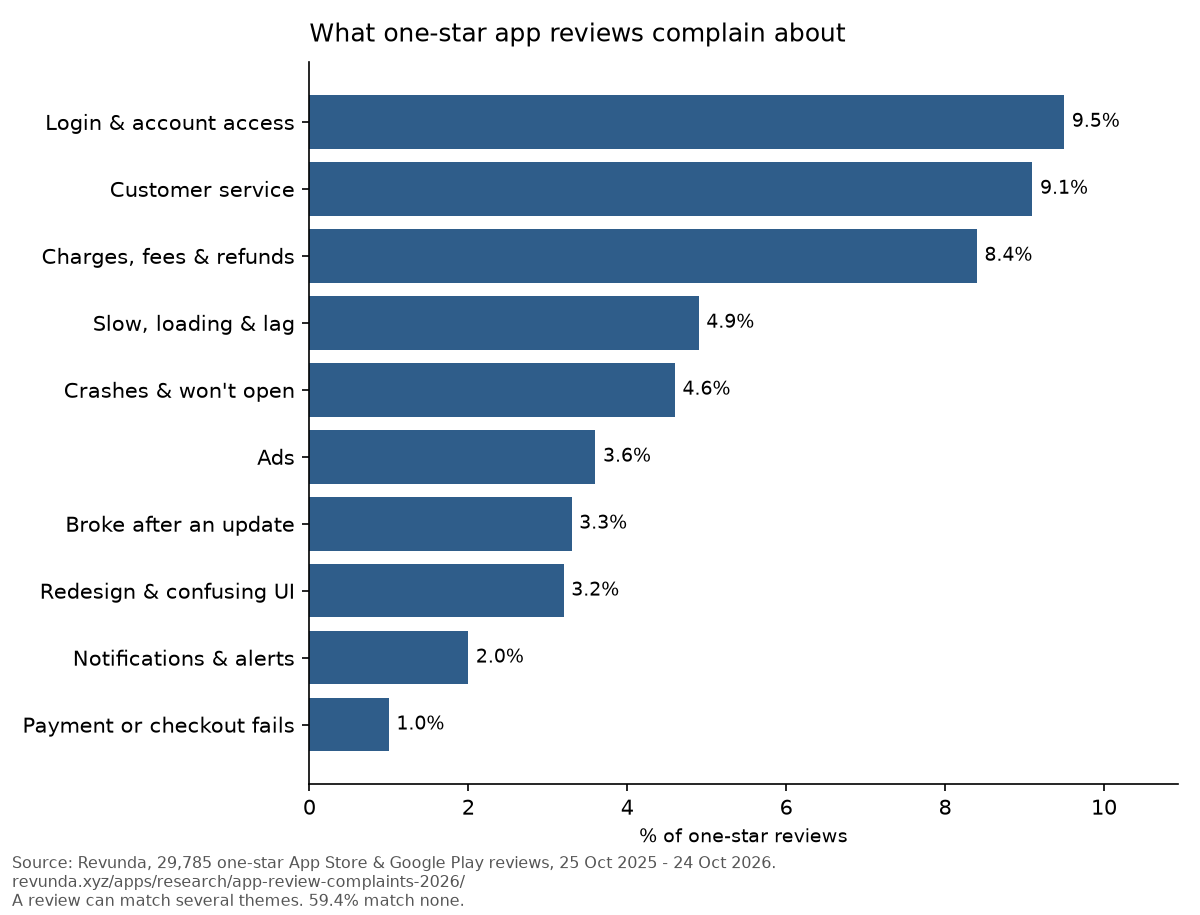
The ranking
| Theme | Share of one-star reviews | Reviews |
|---|---|---|
| Login & account access | 9.5% | 2,821 |
| Customer service | 9.1% | 2,712 |
| Charges, fees & refunds | 8.4% | 2,506 |
| Slow, loading & lag | 4.9% | 1,470 |
| Crashes & won't open | 4.6% | 1,373 |
| Ads | 3.6% | 1,085 |
| Broke after an update | 3.3% | 975 |
| Redesign & confusing UI | 3.2% | 946 |
| Notifications & alerts | 2.0% | 581 |
| Payment or checkout fails | 1.0% | 307 |
59.4% of one-star reviews (17,699) matched none of the ten themes. Many of those are short ("useless", "worst app ever") or are about the company rather than the app.
Login is the top complaint, and it isn't close in some sectors
Login problems lead overall at 9.5%, but the average hides the spikes. In energy and government apps, 24.5% of one-star reviews are about getting in. For insurers it is 18.0%. For parcels and post, 14.1%. For banks and payments, 13.6%.
The apps with the highest login share, among those with at least 100 one-star reviews in the year:
- myGov: 42.1% of 259 one-star reviews
- My O2: 34.9%
- BMO Mobile Banking: 31.0%
- Royal Mail: 30.2%
- State Farm: 30.0%
- NHS App: 28.2%
These are apps people are often required to use. You can't switch tax offices because the app logs you out. So the frustration ends up in the review box. Verification codes that don't arrive, Face ID that stops working after an update, and forced password resets all show up in the text.
If your app sits behind an account, read your one-star reviews for the words "log in", "code" and "password" before you read them for "crash".
Customer service complaints are about the business, not the code
Customer service sits at 9.1% overall. These reviews rarely describe a bug. They describe a refund that never came, a chat bot that loops, or a phone line nobody answers. The app is just where people go to complain.
The country split is the most striking part of the whole dataset:
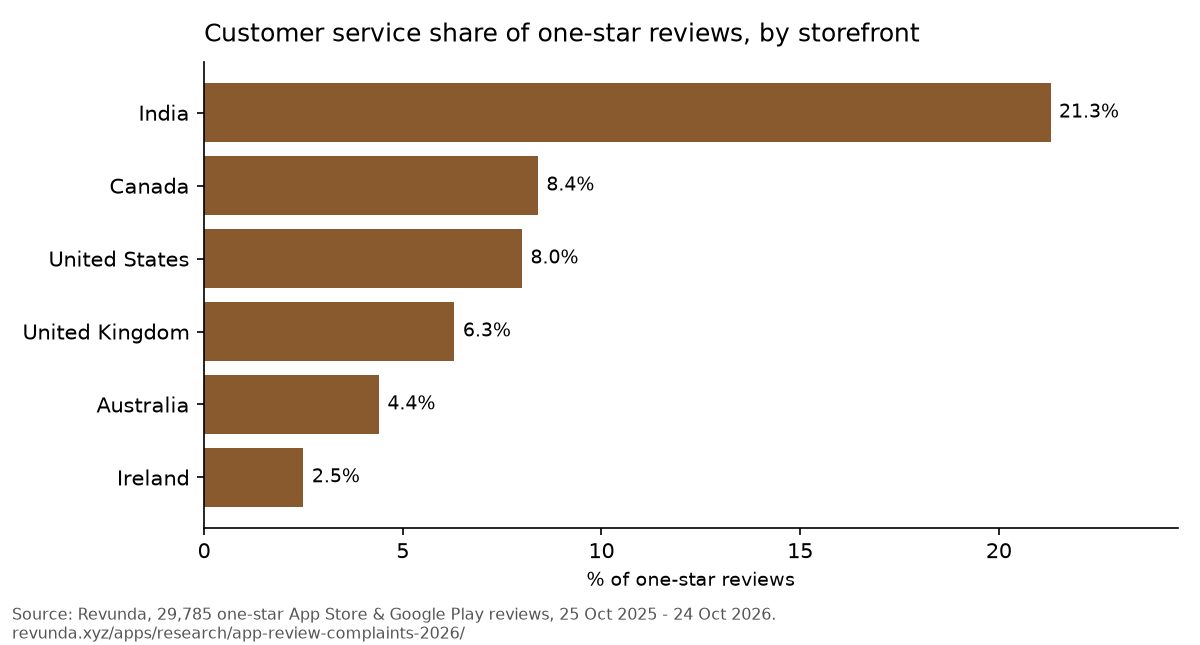
- India: 21.3%
- Canada: 8.4%
- United States: 8.0%
- United Kingdom: 6.3%
- Australia: 4.4%
- Ireland: 2.5%
Part of this is app mix. Shopping and groceries are the largest sector in the Indian sample, at 32.0% of its one-star reviews, and shopping apps attract service complaints. MakeMyTrip (44.2%), Nykaa (42.4%) and Flipkart (33.9%) lead the service ranking. But the gap is large enough that a team shipping to India should expect its review page to double as a support queue.
Login, on the other hand, is only 2.8% of Indian one-star reviews, against 14.5% in Canada.
Money complaints cluster in tickets, taxes and streaming
Charges, fees and refunds come third at 8.4%. In taxis, transit and fuel apps the figure is 15.1%. In streaming, sport and tickets it is 13.9%. Among single apps, Fandango (35.9%) and TurboTax (35.7%) lead the apps with 100 or more one-star reviews.
These reviews tend to be specific. People quote the amount, the date and what they expected to pay. That makes them more useful than most one-star reviews: a pricing page or a checkout screen can be fixed, and the review often tells you which line confused the customer.
Updates hurt smart home and banking most
"Broke after an update" is only 3.3% overall. In smart home and security apps it is 10.3%, the highest of any sector. Banks and payments follow at 5.8%.
Blink Home Monitor is the extreme case: 34.3% of its 140 one-star reviews in the year blame an update. BMO (20.7%), Barclays on iOS (17.6%) and Ring (17.2%) follow. When a camera app or a bank app changes, people notice on the same day, because they open it for something that matters to them.
Ads only matter in a few places, but there they dominate
Ads are 3.6% of one-star reviews overall. In news and weather apps, the figure is 24.7%. Channel 4 (64.8% of 108 one-star reviews), FOX News (43.6%), AccuWeather (30.2%) and ITVX (30.0%) top the list. If you run an ad-funded app, the overall average says nothing about your risk.
iOS users leave more one-star reviews
44.0% of App Store reviews in the sample were one-star, against 29.4% on Google Play. The top theme was the same on both stores: login and account access. We would not read too much into the gap. The two stores sort and surface reviews differently, and our sample has far more App Store listings (227) than Google Play listings (47).
Limits
- The apps are big consumer brands, not a random sample of all apps.
- Regular expressions miss sarcasm, other languages and vague complaints. That is why 59.4% matched nothing.
- Sector shares reflect which apps we picked in each sector.
- Shares only count sectors and countries with at least 100 one-star reviews, and apps with at least 30.
What to do with this
If you run an app, the cheap test is to export your last few hundred one-star reviews and search them for the ten patterns in the study. If login or service beats crashes for you too, the fix may be in your account flow or your support team, not your crash logs.
The full tables, charts, CSV and the exact patterns are in the study on Revunda. The data is CC BY 4.0, so you can reuse the charts with a link.
If you want this for your own app, Revunda's free check reads your latest reviews and sorts the 1 to 3 star ones into themes. No signup.
Free chapter: Login is the real crash (PDF, pay what you want)